Quarto template
This is a Quarto template for multi-language website. We present below example with R and Python.
Setup
Load Python packages
import pandas as pd
import seaborn as sns
import matplotlib.pyplot as plt
import session_info
The pinguin dataset
The goal of palmerpenguins is to provide a great dataset for data exploration & visualization.
Code
| rowid | species | island | bill_length_mm | bill_depth_mm | flipper_length_mm | body_mass_g | sex | year | |
|---|---|---|---|---|---|---|---|---|---|
| Min. : 1.00 | Adelie :152 | Biscoe :168 | Min. :32.10 | Min. :13.10 | Min. :172.0 | Min. :2700 | female:165 | Min. :2007 | |
| 1st Qu.: 86.75 | Chinstrap: 68 | Dream :124 | 1st Qu.:39.23 | 1st Qu.:15.60 | 1st Qu.:190.0 | 1st Qu.:3550 | male :168 | 1st Qu.:2007 | |
| Median :172.50 | Gentoo :124 | Torgersen: 52 | Median :44.45 | Median :17.30 | Median :197.0 | Median :4050 | NA’s : 11 | Median :2008 | |
| Mean :172.50 | Mean :43.92 | Mean :17.15 | Mean :200.9 | Mean :4202 | Mean :2008 | ||||
| 3rd Qu.:258.25 | 3rd Qu.:48.50 | 3rd Qu.:18.70 | 3rd Qu.:213.0 | 3rd Qu.:4750 | 3rd Qu.:2009 | ||||
| Max. :344.00 | Max. :59.60 | Max. :21.50 | Max. :231.0 | Max. :6300 | Max. :2009 | ||||
| NA’s :2 | NA’s :2 | NA’s :2 | NA’s :2 |
Code
str(dt)'data.frame': 344 obs. of 9 variables:
$ rowid : int 1 2 3 4 5 6 7 8 9 10 ...
$ species : Factor w/ 3 levels "Adelie","Chinstrap",..: 1 1 1 1 1 1 1 1 1 1 ...
$ island : Factor w/ 3 levels "Biscoe","Dream",..: 3 3 3 3 3 3 3 3 3 3 ...
$ bill_length_mm : num 39.1 39.5 40.3 NA 36.7 39.3 38.9 39.2 34.1 42 ...
$ bill_depth_mm : num 18.7 17.4 18 NA 19.3 20.6 17.8 19.6 18.1 20.2 ...
$ flipper_length_mm: int 181 186 195 NA 193 190 181 195 193 190 ...
$ body_mass_g : int 3750 3800 3250 NA 3450 3650 3625 4675 3475 4250 ...
$ sex : Factor w/ 2 levels "female","male": 2 1 1 NA 1 2 1 2 NA NA ...
$ year : int 2007 2007 2007 2007 2007 2007 2007 2007 2007 2007 ...Code
dtCode
df = pd.read_csv('./docs/data/palmer-penguins.csv')

df.describe(include='all')
rowid species island ... body_mass_g sex year
count 344.000000 344 344 ... 342.000000 333 344.000000
unique NaN 3 3 ... NaN 2 NaN
top NaN Adelie Biscoe ... NaN male NaN
freq NaN 152 168 ... NaN 168 NaN
mean 172.500000 NaN NaN ... 4201.754386 NaN 2008.029070
std 99.448479 NaN NaN ... 801.954536 NaN 0.818356
min 1.000000 NaN NaN ... 2700.000000 NaN 2007.000000
25% 86.750000 NaN NaN ... 3550.000000 NaN 2007.000000
50% 172.500000 NaN NaN ... 4050.000000 NaN 2008.000000
75% 258.250000 NaN NaN ... 4750.000000 NaN 2009.000000
max 344.000000 NaN NaN ... 6300.000000 NaN 2009.000000
[11 rows x 9 columns]Code
df.info()<class 'pandas.core.frame.DataFrame'>
RangeIndex: 344 entries, 0 to 343
Data columns (total 9 columns):
# Column Non-Null Count Dtype
--- ------ -------------- -----
0 rowid 344 non-null int64
1 species 344 non-null object
2 island 344 non-null object
3 bill_length_mm 342 non-null float64
4 bill_depth_mm 342 non-null float64
5 flipper_length_mm 342 non-null float64
6 body_mass_g 342 non-null float64
7 sex 333 non-null object
8 year 344 non-null int64
dtypes: float64(4), int64(2), object(3)
memory usage: 24.3+ KBCode
df rowid species island ... body_mass_g sex year
0 1 Adelie Torgersen ... 3750.0 male 2007
1 2 Adelie Torgersen ... 3800.0 female 2007
2 3 Adelie Torgersen ... 3250.0 female 2007
3 4 Adelie Torgersen ... NaN NaN 2007
4 5 Adelie Torgersen ... 3450.0 female 2007
.. ... ... ... ... ... ... ...
339 340 Chinstrap Dream ... 4000.0 male 2009
340 341 Chinstrap Dream ... 3400.0 female 2009
341 342 Chinstrap Dream ... 3775.0 male 2009
342 343 Chinstrap Dream ... 4100.0 male 2009
343 344 Chinstrap Dream ... 3775.0 female 2009
[344 rows x 9 columns]Visualization
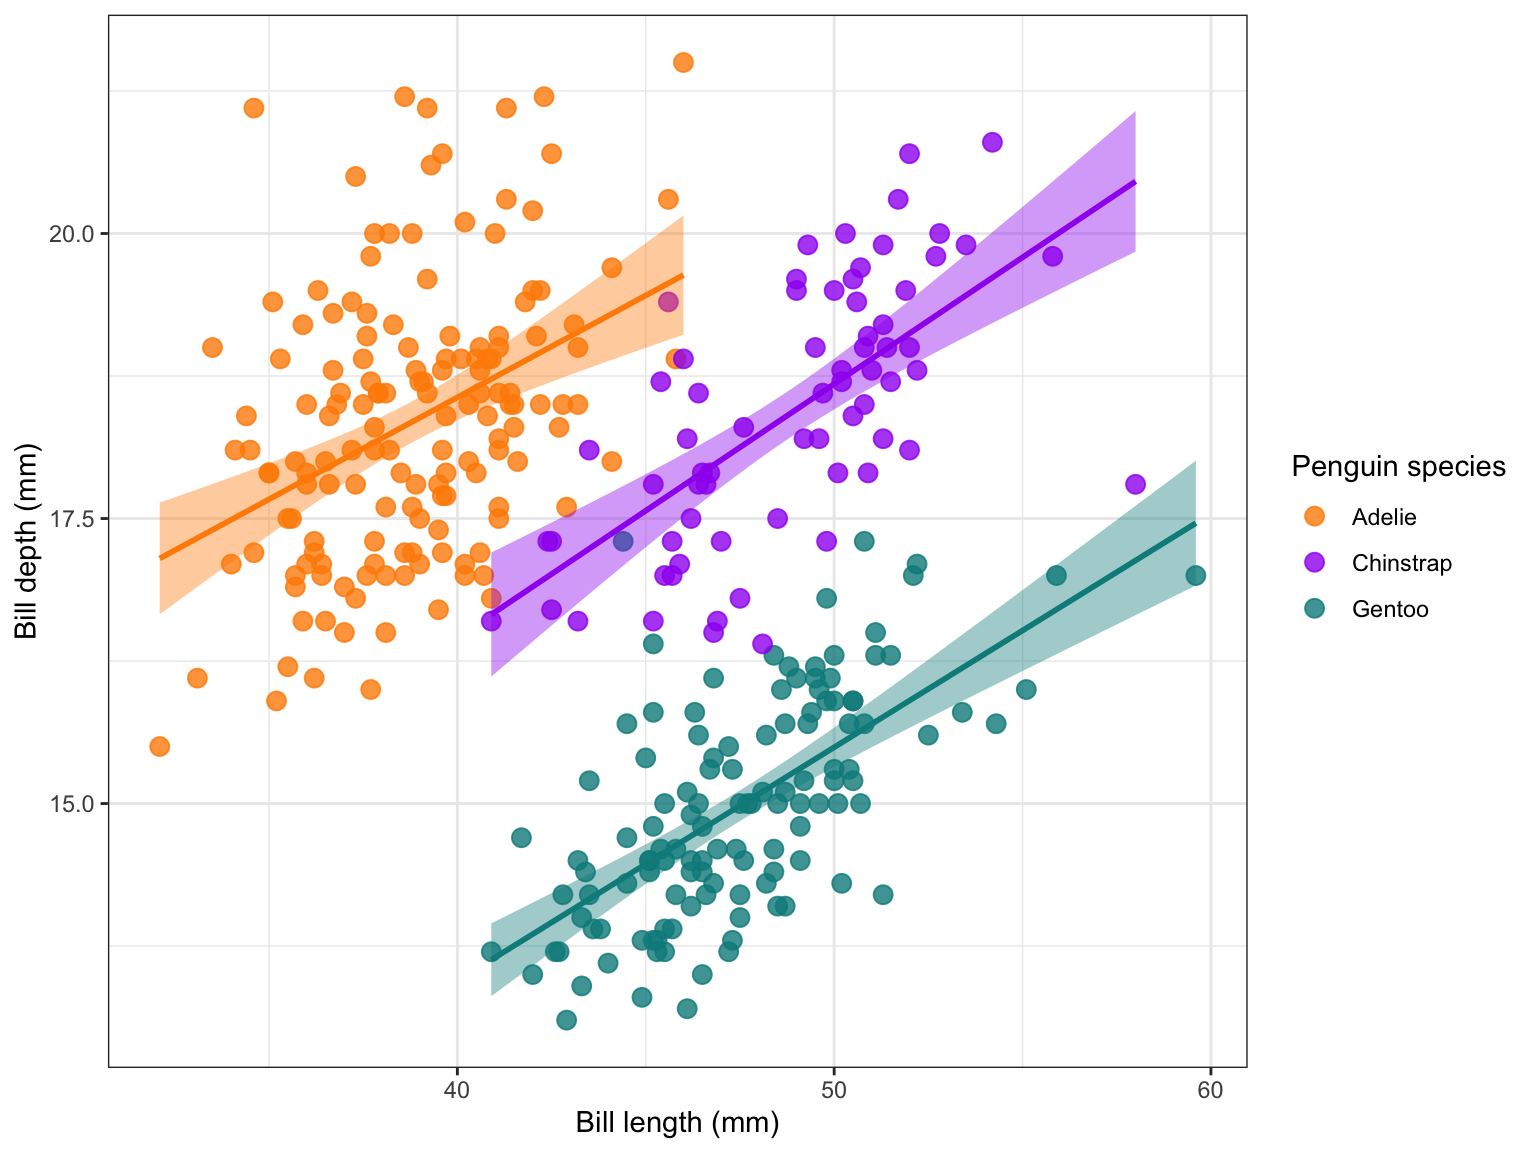
See Figure 1 for an exploration of bill sizes by species.
Code
ggplot(dt, aes(x = bill_length_mm, y = bill_depth_mm, color = species, fill = species)) +
  geom_point(size = 3, alpha = 0.8) +
  geom_smooth(method = "lm", formula = y ~ x, se = T, show.legend = F) +
  scale_discrete_manual(aesthetics = c("colour", "fill"), values = c("darkorange","purple","cyan4")) +
  labs(x = "Bill length (mm)",
       y = "Bill depth (mm)",
       color = "Penguin species",
       fill = "Penguin species") +
  theme_bw()
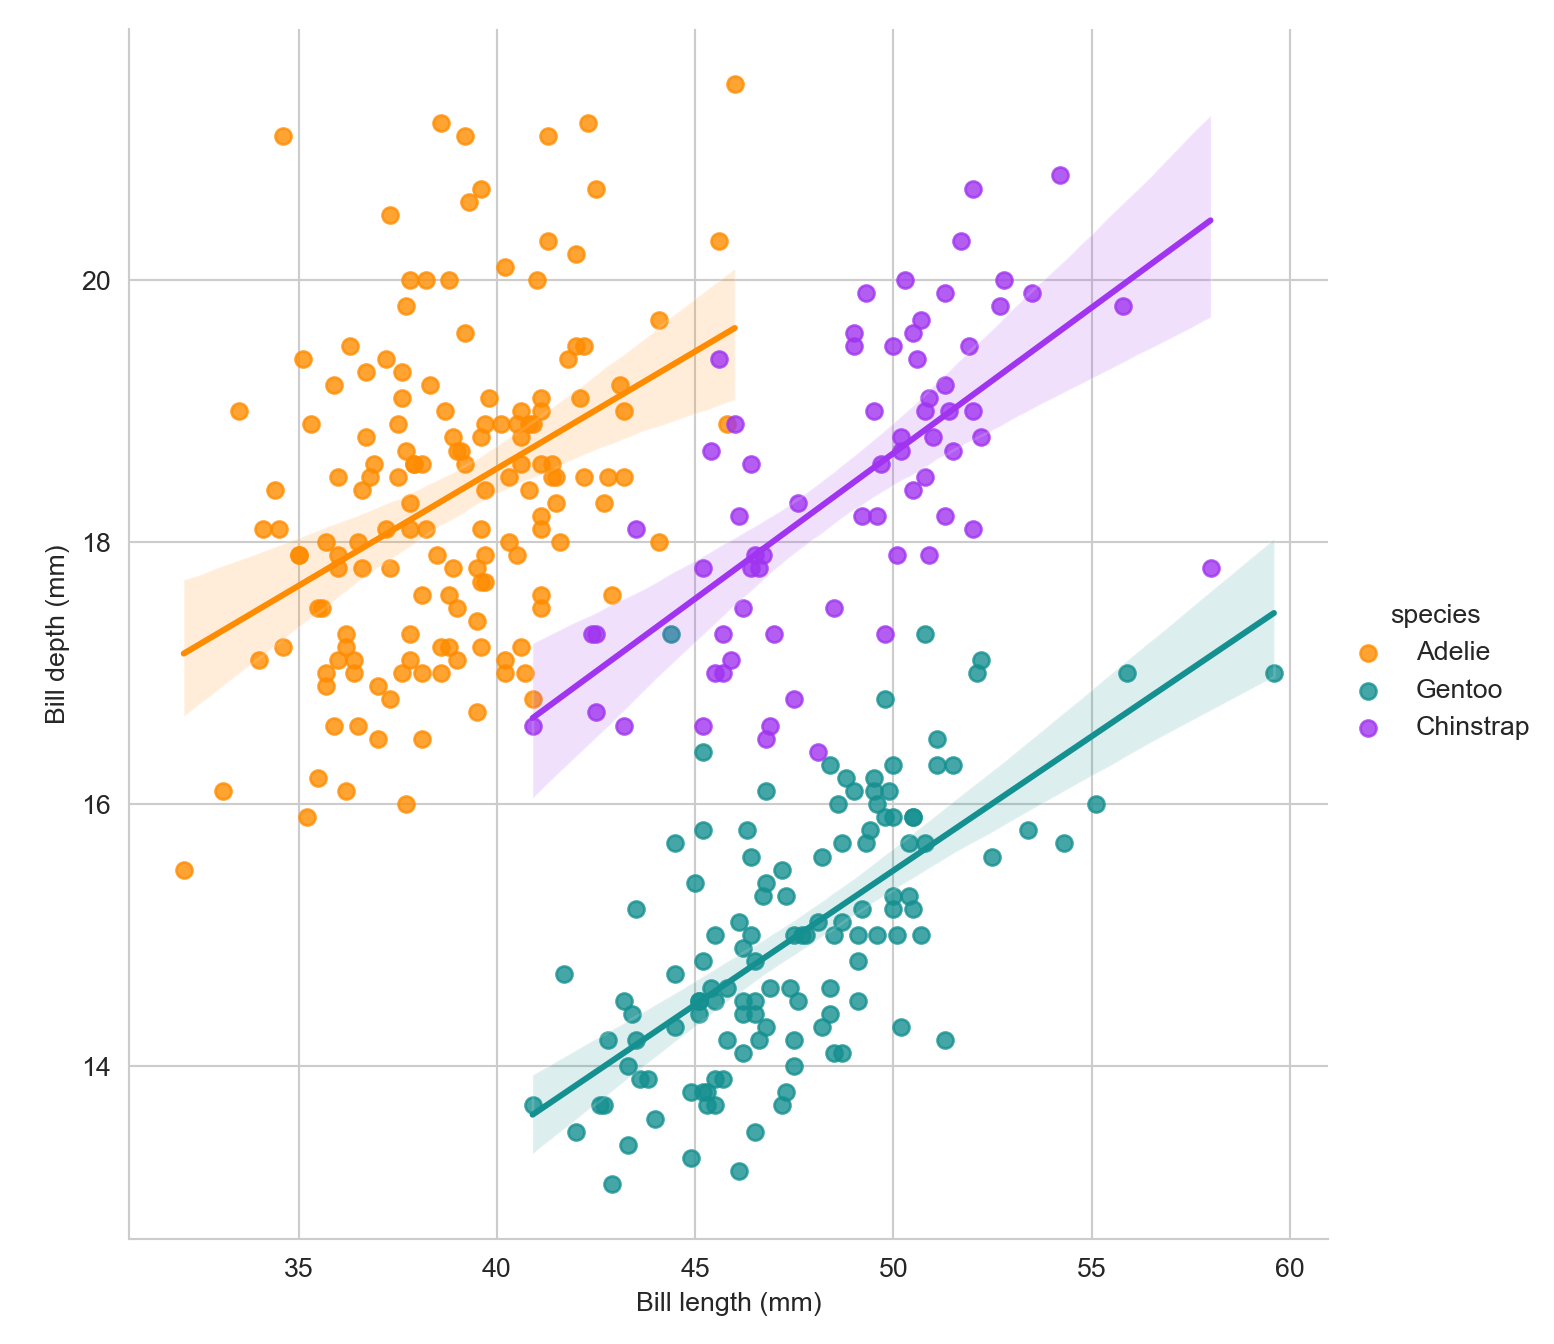
See Figure 2 for an exploration of bill sizes by species.
Code
sns.set_style('whitegrid')

(
  sns.lmplot(x = "bill_length_mm",
               y = "bill_depth_mm",
               hue = "species",
               height = 7,
               data = df,
               palette = ['#FF8C00','#159090','#A034F0'])
  .set_xlabels('Bill length (mm)')
  .set_ylabels('Bill depth (mm)')
);

plt.show()
Session information
Code
R version 4.3.3 (2024-02-29)
Platform: x86_64-apple-darwin20 (64-bit)
Running under: macOS Monterey 12.6.1

Matrix products: default
BLAS:   /Library/Frameworks/R.framework/Versions/4.3-x86_64/Resources/lib/libRblas.0.dylib
LAPACK: /Library/Frameworks/R.framework/Versions/4.3-x86_64/Resources/lib/libRlapack.dylib;  LAPACK version 3.11.0

locale:
[1] en_US.UTF-8/en_US.UTF-8/en_US.UTF-8/C/en_US.UTF-8/en_US.UTF-8

time zone: Europe/Paris
tzcode source: internal

attached base packages:
[1] stats     graphics  grDevices utils     datasets  methods   base

other attached packages:
[1] ggplot2_3.5.1 dplyr_1.1.4

loaded via a namespace (and not attached):
 [1] Matrix_1.6-5      gtable_0.3.5      jsonlite_1.8.8    compiler_4.3.3
 [5] tidyselect_1.2.1  Rcpp_1.0.12       splines_4.3.3     scales_1.3.0
 [9] png_0.1-8         yaml_2.3.8        fastmap_1.2.0     reticulate_1.37.0
[13] lattice_0.22-6    here_1.0.1        R6_2.5.1          labeling_0.4.3
[17] generics_0.1.3    knitr_1.45        htmlwidgets_1.6.4 tibble_3.2.1
[21] munsell_0.5.1     rprojroot_2.0.4   pillar_1.9.0      rlang_1.1.3
[25] utf8_1.2.4        xfun_0.44         cli_3.6.2         withr_3.0.0
[29] magrittr_2.0.3    mgcv_1.9-1        digest_0.6.35     grid_4.3.3
[33] rstudioapi_0.16.0 nlme_3.1-164      lifecycle_1.0.4   vctrs_0.6.5
[37] evaluate_0.23     glue_1.7.0        farver_2.1.2      fansi_1.0.6
[41] colorspace_2.1-0  rmarkdown_2.27    tools_4.3.3       pkgconfig_2.0.3
[45] htmltools_0.5.8.1
Code
session_info.show() # html=False-----
matplotlib 3.7.1
pandas 1.5.3
seaborn 0.13.0
session_info 1.0.0
-----
Python 3.8.16 | packaged by conda-forge | (default, Feb 1 2023, 16:13:45) [Clang 14.0.6 ]
macOS-12.6.1-x86_64-i386-64bit
-----
Session information updated at 2024-09-07 17:40